
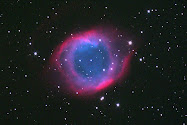
 So what better way to celebrate what we are all about but to show you what you can do with a chunk of glass! I've posted some results with this prism assembly before - the first over 4 years ago with a objective prism spectra of the Hyades star cluster, and 2 years ago with a comet spectrum. It appears that I'm posting w/it every 2 years like clockwork! Anyway, with Melinda mostly feeling under the weather, I've mostly been staying at home, so looking for projects I can do from the back yard. The 4"+ diameter chunk of glass was obtained somewhere, and I polished it flat on both sides with about a 30 degree wedge in it. Mount it up on a mounting surface and you are in business. I originally built it 20 years ago (!) and first used it on comet Hyakutake, and it has been kicking around my storage room since. It is easy to use - mostly point and shoot, the only drawback being that the prism deviates the view of the object spectrum about 20 degrees, so you need to point to something you can see, or build some sort of finder for it. Mostly to this point, I'm using objects I can see in the viewfinder. The image at left shows the setup with my "newish" 300mm lens which works well with it, and the deviation I noted is demonstrated in the right image.
 While the daytime view through the system + prism is a muddled mess of colors, it comes into its own at night. Even though it is well into February, the neighborhood still has strings of lights about, and these are fun to look at. From the spectra, they look like a continuous type you would expect from hot little filaments emitting at all colors. At left is the view of my next-door-neighbor's white lights. From the full spectrum you can spot one of the disadvantages of a prism spectrograph - the dispersion is non-linear from the blue to the red. While the blue part is spread out widely, the red part not so much. For that reason alone, outside objective prism spectra for wide-field surveys such as this setup, most high-resolution work at a telescope is done with diffraction grating devices with more linear dispersion... At right is a similar string of red lights a few doors down on the other side of our house. While also continuous spectra, they are likely filtered with red glass, so mostly only the red part of the spectrum passes. You can spot some of them have small leaks that permit other colors through, but mostly only the red.
 The next really cool thing to do is head down the street a couple hundred yards, looking down Mountain Avenue not far from the house. Shown at left with labels is the intersection of Mountain with the cross-street of Fort Lowell - in this case without the prism, just the 300mm lens. Identified in the image at left are 4 types of lights - low-pressure sodium dominate along Mountain south of Fort Lowell, with high-pressure lighting used at the actual intersection. Also visible is the red traffic light as well as the headlights of cars waiting at the traffic signal. At right is the view through the prism assembly, where you can see all the lights have significantly different spectra. First of all, like the colored light spectra above, the red traffic light is similarly a filtered continuous spectrum showing only red and yellow. The car headlights similar to the full spectrum continuous spectra white lights above also display all colors of the spectrum. The sodium streetlights are significantly different. The spectrum of a gas heated to incandescence make an emission spectrum - glowing brightly at discrete wavelengths. The low pressure ones that stretch down the street are very nearly mono-chromatic with a strong yellow component, with minor red and green emission lines. High pressure sodium is a complex spectrum with pressure-broadened emission in the yellow and red, along with some strong lines in the green and blue from mercury added to the lamps in small quantities. Interestingly, there is self-absorption in the high-pressure sodium at the exact yellow wavelength of low-pressure sodium emission from the outer, cooler parts of the sodium arc that re-absorbs the yellow lines.
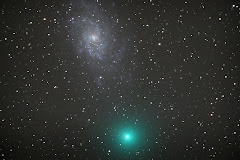
 As you can see here, and from the pictures of the setup on top of the post, the spectral dispersion is vertical. From the back yard, I was thinking that if the stars were bright enough, shooting on the meridian, the east-west motion of the stars (in a standard 8 second exposure)would broaden the spectrum allowing spectral lines to be seen. And it works! With stars, their interiors act as hot sources that provide a continuous spectrum, but cooler gasses in their atmosphere absorb discrete wavelengths that indicate what elements and to some extent, how much of the element is present. Shown at left are the 3 stars of Orion's belt, cropped somewhat so that the absorption lines can be spotted. Since these are very hot "B" stars, they don't have many absorption lines - only a few simple element's atoms can exist at such temperatures. So mostly just weaker hydrogen lines are seen. At right are a pair of stars in Canis Major - In this case, I've turned the spectrum pair 90 degrees CCW so the dispersion is along the long dimension of the image to better see the absorption lines (north is to the left here). The upper star is Epsilon CMa, the lower Sigma CMa. The lower, fainter star is a supergiant over twice as far as the hotter, nearer star, but many more lines can be seen in the cooler atmosphere, where more elements can exist.
 Here I compare two spectra that are very similar - Theta Leporis (A0 V) is magnitude 4.7 and about the faintest I can see visually from my back yard. Sirius (Alpha Canis Majoris) is -1.5, so more than 6 magnitudes (250X) brighter because of its close proximity to us. Shown here are 4 stacked spectral frames (8 seconds each) of Theta Lep, compared to a single of Alpha CMa. Pretty similar results, though noise is visible in the fainter star. The spectral classes are defined so that the Balmer lines of hydrogen are strongest in the "A" stars. Note how much stronger they are in these stars, compared to the hotter "B" stars of Epsilon CMa and Epsilon Ori above.
So similarly, I took a series of spectra using the device, using 8 second exposures as my standard widening width. I used the 300mm F/number and camera ISO (standard Canon XSi to fine tune exposures for bright to faint stars, using multiple exposures (up to 4) for the faintest stars. Checking with Wikipedia for spectral classifications, I then plotted up a variety of stars from hottest (top) to coolest. It was interesting to confirm the hydrogen Balmer lines are strongest at about "A" spectral class, and as you get cooler many more elements can exist (thus absorb wavelengths) in the stellar atmospheres. At the bottom (Alpha Orionis - Betelgeuse) is cool enough that molecular bands can be seen absorbing over a gap of wavelengths.
I'm still amazed that I can detect what elements can exist in a star's atmosphere 2,000 light years away - and from that and the star's brightness, you can make assumptions about temperature, mass, and chemistry - all from an inexpensive camera and simple piece of glass. Fun stuff!


No comments:
Post a Comment